CoCalc Logo Icon
StoreFeaturesDocsShareSupportNewsAboutSign UpSign In
DanielBarnes18

Real-time collaboration for Jupyter Notebooks, Linux Terminals, LaTeX, VS Code, R IDE, and more,
all in one place.

GitHub Repository: DanielBarnes18/IBM-Data-Science-Professional-Certificate
Path: blob/main/06. Databases and SQL for Data Science with Python/05. Course Assignment/Notebook for Peer Assignment.ipynb
Views: 4267
Kernel: Python 3
cognitiveclass.ai logo

Assignment: Notebook for Peer Assignment

Introduction

Using this Python notebook you will:

  1. Understand three Chicago datasets

  2. Load the three datasets into three tables in a Db2 database

  3. Execute SQL queries to answer assignment questions

Understand the datasets

To complete the assignment problems in this notebook you will be using three datasets that are available on the city of Chicago's Data Portal:

  1. Socioeconomic Indicators in Chicago

  2. Chicago Public Schools

  3. Chicago Crime Data

1. Socioeconomic Indicators in Chicago

This dataset contains a selection of six socioeconomic indicators of public health significance and a “hardship index,” for each Chicago community area, for the years 2008 – 2012.

A detailed description of this dataset and the original dataset can be obtained from the Chicago Data Portal at: https://data.cityofchicago.org/Health-Human-Services/Census-Data-Selected-socioeconomic-indicators-in-C/kn9c-c2s2

2. Chicago Public Schools

This dataset shows all school level performance data used to create CPS School Report Cards for the 2011-2012 school year. This dataset is provided by the city of Chicago's Data Portal.

A detailed description of this dataset and the original dataset can be obtained from the Chicago Data Portal at: https://data.cityofchicago.org/Education/Chicago-Public-Schools-Progress-Report-Cards-2011-/9xs2-f89t

3. Chicago Crime Data

This dataset reflects reported incidents of crime (with the exception of murders where data exists for each victim) that occurred in the City of Chicago from 2001 to present, minus the most recent seven days.

A detailed description of this dataset and the original dataset can be obtained from the Chicago Data Portal at: https://data.cityofchicago.org/Public-Safety/Crimes-2001-to-present/ijzp-q8t2

Download the datasets

This assignment requires you to have these three tables populated with a subset of the whole datasets.

In many cases the dataset to be analyzed is available as a .CSV (comma separated values) file, perhaps on the internet. Click on the links below to download and save the datasets (.CSV files):

NOTE: Ensure you have downloaded the datasets using the links above instead of directly from the Chicago Data Portal. The versions linked here are subsets of the original datasets and have some of the column names modified to be more database friendly which will make it easier to complete this assignment.

Store the datasets in database tables

To analyze the data using SQL, it first needs to be stored in the database.

While it is easier to read the dataset into a Pandas dataframe and then PERSIST it into the database as we saw in Week 3 Lab 3, it results in mapping to default datatypes which may not be optimal for SQL querying. For example a long textual field may map to a CLOB instead of a VARCHAR.

Therefore, it is highly recommended to manually load the table using the database console LOAD tool, as indicated in Week 2 Lab 1 Part II. The only difference with that lab is that in Step 5 of the instructions you will need to click on create "(+) New Table" and specify the name of the table you want to create and then click "Next".
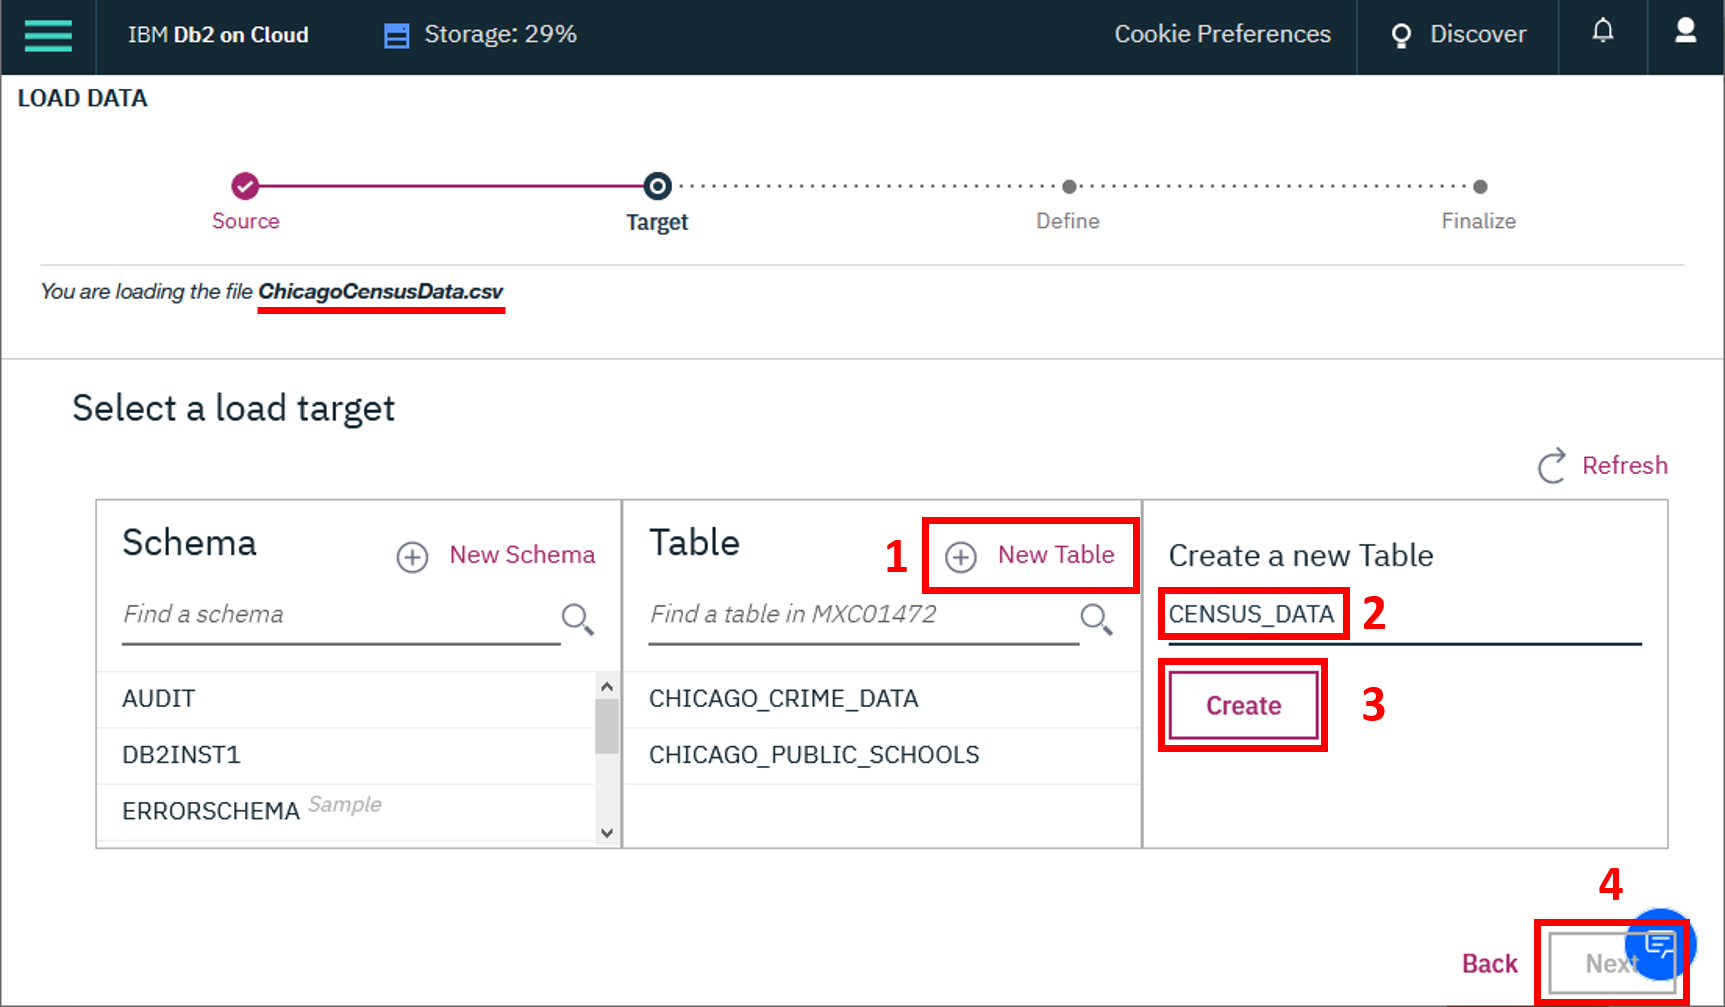
Now open the Db2 console, open the LOAD tool, Select / Drag the .CSV file for the first dataset, Next create a New Table, and then follow the steps on-screen instructions to load the data. Name the new tables as follows:
  1. CENSUS_DATA

  2. CHICAGO_PUBLIC_SCHOOLS

  3. CHICAGO_CRIME_DATA

Connect to the database

Let us first load the SQL extension and establish a connection with the database

!pip install sqlalchemy==1.3.9 !pip install ibm_db_sa
Requirement already satisfied: sqlalchemy==1.3.9 in /home/jupyterlab/conda/envs/python/lib/python3.6/site-packages (1.3.9) Requirement already satisfied: ibm_db_sa in /home/jupyterlab/conda/envs/python/lib/python3.6/site-packages (0.3.3) Requirement already satisfied: sqlalchemy>=0.7.3 in /home/jupyterlab/conda/envs/python/lib/python3.6/site-packages (from ibm_db_sa) (1.3.9)
%load_ext sql

In the next cell enter your db2 connection string. Recall you created Service Credentials for your Db2 instance in first lab in Week 3. From the uri field of your Db2 service credentials copy everything after db2:// (except the double quote at the end) and paste it in the cell below after ibm_db_sa://

# Remember the connection string is of the format: # %sql ibm_db_sa://my-username:my-password@my-hostname:my-port/my-db-name # Enter the connection string for your Db2 on Cloud database instance below %sql ibm_db_sa://kfm42587:6zkhf3chpx0-m9cl@dashdb-txn-sbox-yp-lon02-13.services.eu-gb.bluemix.net:50000/BLUDB
'Connected: kfm42587@BLUDB'

Problems

Now write and execute SQL queries to solve assignment problems

Problem 1

Find the total number of crimes recorded in the CRIME table.
%%sql SELECT COUNT(*) FROM CRIME_DATA
* ibm_db_sa://kfm42587:***@dashdb-txn-sbox-yp-lon02-13.services.eu-gb.bluemix.net:50000/BLUDB Done.

Problem 2

List community areas with per capita income less than 11000.
%%sql SELECT COMMUNITY_AREA_NAME FROM CENSUS_DATA WHERE PER_CAPITA_INCOME < 11000
* ibm_db_sa://kfm42587:***@dashdb-txn-sbox-yp-lon02-13.services.eu-gb.bluemix.net:50000/BLUDB Done.

Problem 3

List all case numbers for crimes involving minors?(children are not considered minors for the purposes of crime analysis)
%%sql SELECT CASE_NUMBER FROM CRIME_DATA WHERE DESCRIPTION LIKE '%MINOR%'
* ibm_db_sa://kfm42587:***@dashdb-txn-sbox-yp-lon02-13.services.eu-gb.bluemix.net:50000/BLUDB Done.

Problem 4

List all kidnapping crimes involving a child?
%%sql SELECT DESCRIPTION FROM CRIME_DATA WHERE PRIMARY_TYPE = 'KIDNAPPING' AND DESCRIPTION LIKE '%CHILD%'
* ibm_db_sa://kfm42587:***@dashdb-txn-sbox-yp-lon02-13.services.eu-gb.bluemix.net:50000/BLUDB Done.

Problem 5

What kinds of crimes were recorded at schools?
%%sql SELECT DISTINCT(PRIMARY_TYPE) FROM CRIME_DATA WHERE LOCATION_DESCRIPTION LIKE '%SCHOOL%'
* ibm_db_sa://kfm42587:***@dashdb-txn-sbox-yp-lon02-13.services.eu-gb.bluemix.net:50000/BLUDB Done.

Problem 6

List the average safety score for all types of schools.
%%sql SELECT SCHOOL_TYPE, AVG(SAFETY_SCORE) AS AVERAGE_SAFETY_SCORE FROM PUBLIC_SCHOOLS GROUP BY SCHOOL_TYPE
* ibm_db_sa://kfm42587:***@dashdb-txn-sbox-yp-lon02-13.services.eu-gb.bluemix.net:50000/BLUDB Done.

Problem 7

List 5 community areas with highest % of households below poverty line
%%sql SELECT COMMUNITY_AREA_NAME, PERCENT_HOUSEHOLDS_BELOW_POVERTY FROM CENSUS_DATA ORDER BY PERCENT_HOUSEHOLDS_BELOW_POVERTY DESC LIMIT 5
* ibm_db_sa://kfm42587:***@dashdb-txn-sbox-yp-lon02-13.services.eu-gb.bluemix.net:50000/BLUDB Done.

Problem 8

Which community area is most crime prone?
%%sql SELECT COMMUNITY_AREA_NUMBER, COUNT(*) AS NO_OF_CRIMES FROM CRIME_DATA GROUP BY COMMUNITY_AREA_NUMBER ORDER BY NO_OF_CRIMES DESC LIMIT 1
* ibm_db_sa://kfm42587:***@dashdb-txn-sbox-yp-lon02-13.services.eu-gb.bluemix.net:50000/BLUDB Done.

Problem 9

Use a sub-query to find the name of the community area with highest hardship index
%%sql SELECT COMMUNITY_AREA_NAME FROM CENSUS_DATA WHERE HARDSHIP_INDEX = (SELECT MAX(HARDSHIP_INDEX) FROM CENSUS_DATA)
* ibm_db_sa://kfm42587:***@dashdb-txn-sbox-yp-lon02-13.services.eu-gb.bluemix.net:50000/BLUDB Done.

Problem 10

Use a sub-query to determine the Community Area Name with most number of crimes?
%%sql SELECT COMMUNITY_AREA_NAME FROM CENSUS_DATA WHERE COMMUNITY_AREA_NUMBER = (SELECT COMMUNITY_AREA_NUMBER FROM CRIME_DATA GROUP BY COMMUNITY_AREA_NUMBER ORDER BY COUNT(*) DESC LIMIT 1)
* ibm_db_sa://kfm42587:***@dashdb-txn-sbox-yp-lon02-13.services.eu-gb.bluemix.net:50000/BLUDB Done.