
Path: blob/main/seminar3/morphometry_classification_2022.ipynb
107 views
![]()
MRI classification on morphometry data
1. Introduction
In this notebook we will do conventional morphometry analysis for gender-related morphometric sighns search.
Our goal will be to build a network for MEN and WOMEN brain classification, to explore gender influence on brain structure and find gender-specific biomarkers.
We will use the data from https://db.humanconnectome.org/data/projects/HCP_1200.
Proceeding with this Notebook you confirm your personal acess to the data. And your agreement on data terms and conditions.
2. Mounting Google Drive to Collab Notebook. You should go with the link and enter your personal authorization code:
!!! Add a shortcut with "Add a shortcut" with the data repository from here https://drive.google.com/drive/folders/1GCIXnK6ly5l_LADanpLmvtZ6YbqPUamQ?usp=sharing
After adding a shotcut change this data dir to yours own files location in Google drive and give a path to seminars/anat folder:
Importing the data
Importing unrestricted_freesurfer.csv dataset from https://db.humanconnectome.org/data/projects/HCP_1200.
How to get this morpometry data inhouse?
You should have T1 weighted MRI, or T1 with T2.
Should have patients data in
BIDSor converted in*.nii.Run
fsdockeror standalon installedfreesurfer 6.0.Wait 5-11 hours on 1 CPU per patient.
Get freesurfer stats as output and convert them in table format.
The tutorial and data for table creation as well as data visualisation can be found here: https://github.com/kondratevakate/your-brain-mri-visualization
Defining the train and test data
In is a set of brain morphometry measures of healthy young adults. On the data we have two classification plobles to solve:
men/women classification.
age above 30n classification.
Choose your X (train_data) and y (train_targets) as pandas.DataFrame() or numpy.array():
Let's change str values to binary classes. The easy but BAD way is:
Let's do classical data analysis
Statistics:
Pick up a test for two grups comparison (gaussian/ parametric or not?)
Is it paired test or not?
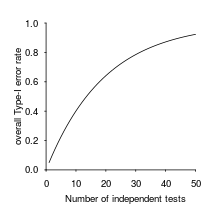
Choose a p-value and address the multiple comparisons.
What about feature selection?
https://scikit-learn.org/stable/modules/generated/sklearn.feature_selection.SelectKBest.html
What do you know about multiple comparisons?

One bad paper to look at: https://arxiv.org/pdf/1604.05992.pdf
And one good paper: https://www.ncbi.nlm.nih.gov/pmc/articles/PMC3056175/
Now we are doing ML!
Defining model grid search. Defining new object of Grid Cross Validation Linear class:
What else?
Hyperparameter search and model optimisation. Comparison of model performance with statistical testing.
Model interpretation
Biomarkers stability
Biomarkers statistical approval
How we can explore the found morphometry biomarkers from here?
How do we compare the performance of two classificational models?
Nice work with recommendations on models comparison: https://arxiv.org/pdf/1806.08295.pdf